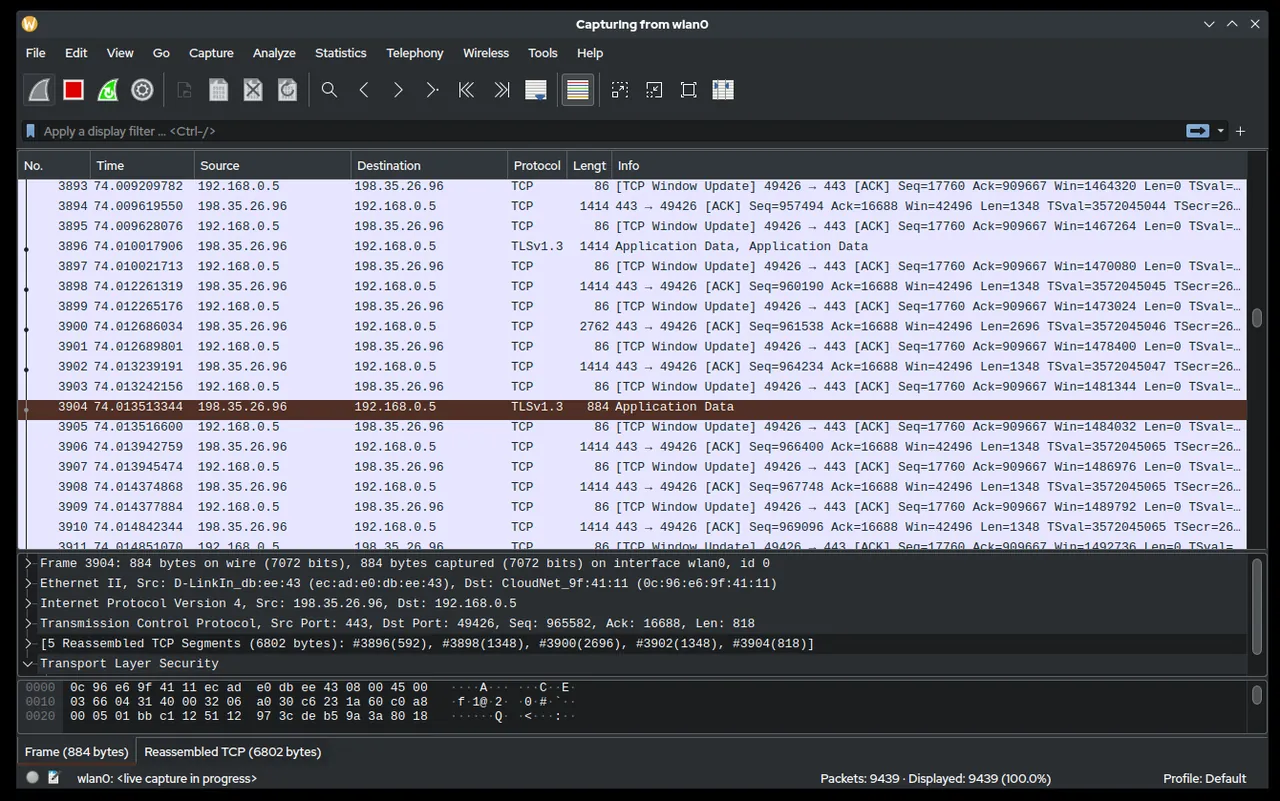
Latency is flat, loss is zero, iPerf3 hits line rate, and the ERP client still freezes for eight seconds every time a user saves an invoice. At this point graphs have run out of things to say. The question is no longer “is the path healthy?” but “what exactly happens on the wire during those eight seconds?” — a DNS query that times out, a TCP retransmission storm, a server that waits for a zero-window to clear. Wireshark is how you see it.
What Wireshark does
Wireshark is an open-source network protocol analyzer. It captures frames from an interface on your own machine — or reads a capture file taken elsewhere with tcpdump, dumpcap, a switch’s mirror port or a firewall’s packet capture feature — and decodes each frame through thousands of protocol dissectors, from Ethernet and 802.1Q through IP, TCP, TLS and HTTP/2 to SMB, Kerberos, SIP and RTP.
It is maintained under the Wireshark Foundation and licensed under GPLv2. As of this review, 4.6.9 (September 23, 2026) is the stable branch, with 4.4.19 shipped the same day as a maintenance update. It runs on Windows, macOS, Linux and other UNIX systems. On Windows, live capture relies on the Npcap driver; on Linux and macOS it uses libpcap, and the privilege to capture can be given to a dedicated group instead of running the whole GUI as root.
The core workflow:
- Capture on the right interface, ideally with a capture filter such as
host 10.0.5.20 and port 443to keep files small. - Narrow the view with display filters:
tcp.analysis.retransmission,dns.flags.rcode != 0,tcp.time_delta > 1. - Use Statistics → Conversations, I/O Graphs and Expert Information to find the flows and events that matter.
- Follow a single stream (Follow → TCP Stream) to read the exchange in order.
Where it’s strong: unarguable, shareable evidence
A trimmed pcap file is the most portable evidence in networking. Hand a vendor a 2 MB capture showing their server advertising a zero TCP window for 7.8 seconds after each request, and the conversation changes. Wireshark’s Export Specified Packets lets you cut a capture down to the relevant conversation before sending it, which also limits what private data you share.
- Time-to-answer is short once you know the filters. A problem that reproduces on demand can often be pinned down within one capture.
- TCP analysis flags — retransmissions, duplicate ACKs, window full, zero window — point straight at the side causing trouble.
- VoIP tooling reconstructs RTP streams and computes jitter and loss per call, useful when the complaint is audio quality.
- Decryption of TLS is possible when you control the client and can export session keys via
SSLKEYLOGFILE, which is often the only way to read modern application traffic. - tshark, the CLI companion, runs the same dissectors headless for scripted or remote analysis.
Where it falls short, and who should skip it
Wireshark is only as good as the capture point. Running it on your laptop shows your laptop’s traffic; on a switched network you will not see traffic between two other hosts without a SPAN/mirror port, a network tap or a capture on one of the endpoints. Planning the capture point is often the hardest part.
It has a steep learning curve. Reading TCP sequence numbers and window behaviour takes practice, and a first capture on a busy segment can feel overwhelming. For the simpler question “which process holds this connection open?” on a Windows host, TCPView answers in seconds with no capture at all.
It is not a monitoring system. Captures are snapshots; long-running full capture fills disks fast. For trends and alerting, look at SmokePing or Obkio. And it measures nothing about capacity: if the question is bandwidth, use iPerf3.
Captured traffic can contain passwords, personal data and session tokens. Capture only on networks you own or are explicitly authorized to monitor, store pcaps like any other sensitive data, and check your organization’s policy before capturing user traffic.
Who it suits
- Network and systems admins who need root cause, not just symptoms.
- Anyone escalating to an application vendor who insists the network is to blame.
- VoIP and UC administrators tracing SIP signalling and RTP media problems.
Licensing and cost
Wireshark is free and open source under GPLv2. There is no paid edition. Training and certification exist from third parties and the foundation’s community events, but the software itself costs nothing.
How it compares
The natural comparison on this site is with TCPView: one decodes every packet, the other lists live sockets per process. Wireshark vs TCPView explains when each is the right first move. Relative to path tools such as PingPlotter and mtr, Wireshark sits one layer down: they tell you where, Wireshark tells you what. See the full throughput and packet inspection category.
Getting it safely
The only source you need is wireshark.org. Every release there comes with a signed file listing its SHA-256 hashes, and Windows packages are Authenticode-signed by the Wireshark Foundation; check both before running. On Linux, the distribution’s signed packages are the simplest route, though they may lag the latest stable. Let the Windows package bring Npcap rather than fetching a driver from elsewhere. The broader sourcing checklist lives on where to get it, and the methodology page describes how packet tools are judged here.
FAQ
Can I capture traffic between two other machines on my network?
Only if that traffic reaches your capture point. On a switched LAN, use a mirror (SPAN) port, a tap, or capture on one of the two machines with dumpcap or tcpdump and open the file in Wireshark. Do this only on networks you administer or are authorized to monitor.
Why do I see “TCP Checksum incorrect” on my own outgoing packets?
Checksum offloading: the NIC computes the checksum after Wireshark sees the packet. It’s a display artifact, not a fault, and the check can be disabled in the TCP protocol preferences.
How do I read HTTPS traffic?
Set the SSLKEYLOGFILE environment variable for a browser or client you control, then point Wireshark’s TLS preferences at that key log file. Without keys, you see handshake metadata but not content.
Is tshark enough on a server without a GUI?
For capture and filtering, yes. Many admins capture with dumpcap or tshark on the server and analyse the file in the GUI on their workstation.