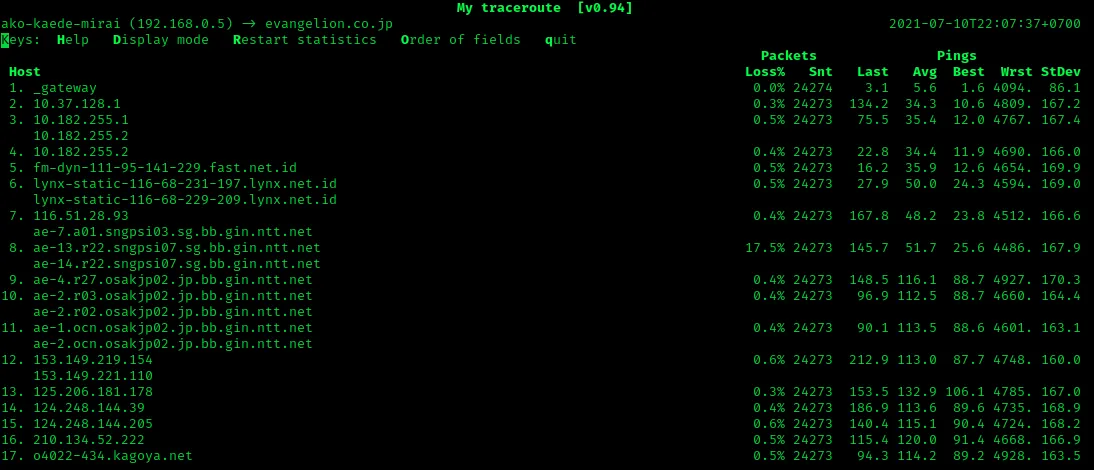
You are on a jump host at 2 a.m., a branch office says its VPN keeps stalling, and there is no GUI anywhere in sight. You need to know, within minutes, whether packets are dying inside your edge, on the provider’s backbone, or near the far end. The tool almost every Linux distribution will hand you for that question is mtr — a few characters to type, and a table that refreshes every second.
What mtr does
mtr (originally “Matt’s traceroute”) combines traceroute and ping. It discovers the path by sending probes with increasing TTL values, then keeps probing every hop in rounds, accumulating statistics: sent count, loss percentage, and last, average, best and worst round-trip time plus standard deviation. The curses interface updates live in a terminal; a GTK front end exists for desktops, but most admins meet mtr over SSH.
The project is licensed under GPLv2 and is maintained in the traviscross/mtr repository on GitHub; the original BitWizard page now mostly points there. The most recent tag at the time of writing is v0.96, from July 2025, following v0.95 in January 2022. It builds with autoconf on Linux, the BSDs and macOS, and runs on Windows through WSL or Cygwin. Raw socket work is delegated to a small helper, mtr-packet, which is installed setuid-root so the main program can run unprivileged.
Where it’s strong: fast, scriptable, pasteable
For evidence gathering, the killer feature is report mode. Instead of a live screen, mtr sends a fixed number of rounds and prints a static table:
mtr --report --report-wide --report-cycles 200 -i 0.5 vpn.example.netThat gives you 200 samples per hop at half-second intervals, in about two minutes, as text that survives email, ticket systems and chat. Carriers’ NOCs are used to receiving exactly this format, and many will ask for it by name.
Other things mtr does well:
- TCP and UDP probing.
-T -P 443sends TCP SYNs to port 443;-uswitches to UDP. When a provider polices ICMP differently from real traffic, probing with the protocol the application uses gives a truer picture. - AS numbers per hop.
-zlooks up the autonomous system for each hop, so you can see where the path leaves your ISP and enters a transit provider — the boundary where escalations usually get argued. - Machine-readable output.
--json,--csvand--xmllet you feed results into a script or a monitoring pipeline, for example running a report from cron every 15 minutes and archiving it. - IPv4/IPv6 control.
-4and-6pin the address family, which matters when a dual-stack host silently prefers the broken one.
Where it falls short, and who should skip it
mtr has no memory. Close the session and the numbers are gone unless you saved a report. For a problem that appears once a day, you either script repeated reports yourself or reach for something with a timeline, such as PingPlotter or SmokePing.
It also asks the reader to know how to read it. The most common misreading is loss on a middle hop that does not carry through to the destination — that is a router rate-limiting replies to itself, not a fault. A line manager or an ISP’s first-line agent may not know that, and a table full of red-flagged percentages can start the wrong argument. Our guide to finding where packet loss really starts covers the reading rules.
Windows users get a second-class experience. There is no native Windows build from the project; WSL works, but ICMP behaviour under WSL networking modes can differ from the host’s own stack. Help desks that live on Windows laptops will usually be happier with a GUI tool. And mtr says nothing about bandwidth: a clean trace on a link that tops out at 40 Mbit/s instead of 500 needs iPerf3.
Who it suits
- Linux and network admins who already work over SSH and want an answer before the coffee cools.
- Anyone building scripted, repeatable path checks from servers or routers running a Linux userland.
- Engineers escalating to a carrier that expects text output in the ticket.
Licensing and cost
mtr is free software under the GNU General Public License v2. There is no paid edition, no licence key and no vendor support contract; support is the GitHub issue tracker and your distribution’s maintainers. On most systems you obtain it from the distribution’s own repositories (apt install mtr-tiny for the curses-only build on Debian and Ubuntu, dnf install mtr on Fedora and RHEL-family systems, brew install mtr on macOS).
How it compares
The obvious rival is PingPlotter: graphs, history and a shareable report versus zero cost and instant availability over SSH. We weigh the two head to head in PingPlotter vs mtr. For a permanent, historical latency record from a server, SmokePing is the natural companion — mtr for “right now,” SmokePing for “since last Tuesday.” Other options are listed in the latency and path analysis category.
Getting it safely
Prefer your operating system’s package manager: packages are signed by the distribution, and apt, dnf and pkg verify those signatures automatically. If you build from source, clone traviscross/mtr from GitHub and check the tag you are building (git tag -v if the tag is signed, or at least compare the commit against the repository’s web view). Be wary of prebuilt Windows ports from unknown sites. See where to get tools safely and how we research reviews.
FAQ
Why does mtr need root or a setuid helper?
Sending probes with arbitrary TTL values and reading ICMP “time exceeded” replies requires raw sockets. mtr isolates that privilege in mtr-packet, so the interface itself runs as your normal user.
What report cycle count should I use for an ISP ticket?
A hundred to a few hundred cycles is a common choice. Ten cycles means each lost packet is 10% loss, which exaggerates noise; a few hundred gives a percentage that means something. Run it from both ends of the path if you can.
Why is the destination slower than an intermediate hop, or the other way round?
Each hop’s time measures how quickly that router answers a probe addressed to it, which is often a low-priority job for its CPU. Only the destination’s time reflects the full path. A single slow middle hop with normal times after it is usually harmless.
Does mtr work through firewalls that drop ICMP?
Often, if you switch to TCP mode with -T -P 443 (or another port the firewall allows). Some hops will still stay silent, shown as ???, which is normal.